Steph W. from SEOPressor


...help you check your website and tell you exactly how to rank higher?

94
score %
SEO Score

Found us from search engine?
We rank high, you can too.
SEOPressor helps you to optimize your on-page SEO for higher & improved search ranking.
By jiathong on November 3, 2020

Google Analytics offers a compelling way to monitor and track your website’s performance and progress.
With robust features that enable it to track your site’s social engagement, ascertain your conversion rate as well as understand your target audience, the platform is a sure-fire way to optimize your blog or brand’s potential online.
That said, the tool requires some knowledge to understand. To a casual or newbie user, it can be overwhelming; there are tens of menus and terminologies in there. The information can easily be misinterpreted because of the many distinctly similar terms used throughout.
Nonetheless, armed with a clear understanding and the right knowledge, there is absolutely no reason why you cannot master the handy tool. To help you with that, here are the main google analytics glossary definitions;
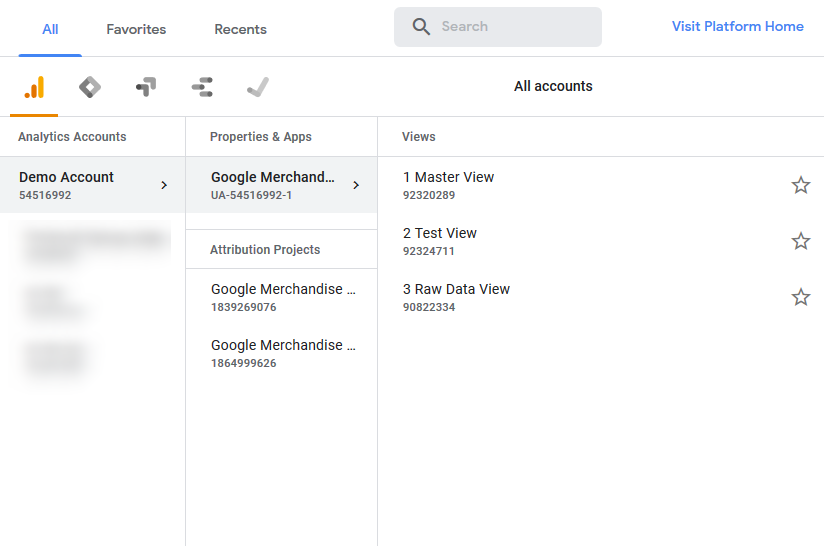
This is the home of all your site’s data. It is like the interface you get immediately you try to log into a computer (where you have to key in your user details to access). In most cases, the top-level account is the one storing all your data in different folders.
The same applies to a Google Analytics Account. It has every detail of your site. However, if you are managing several sites that are not related, you will have to use different accounts. For instance, if you have a personal blog and also operating a firm website.
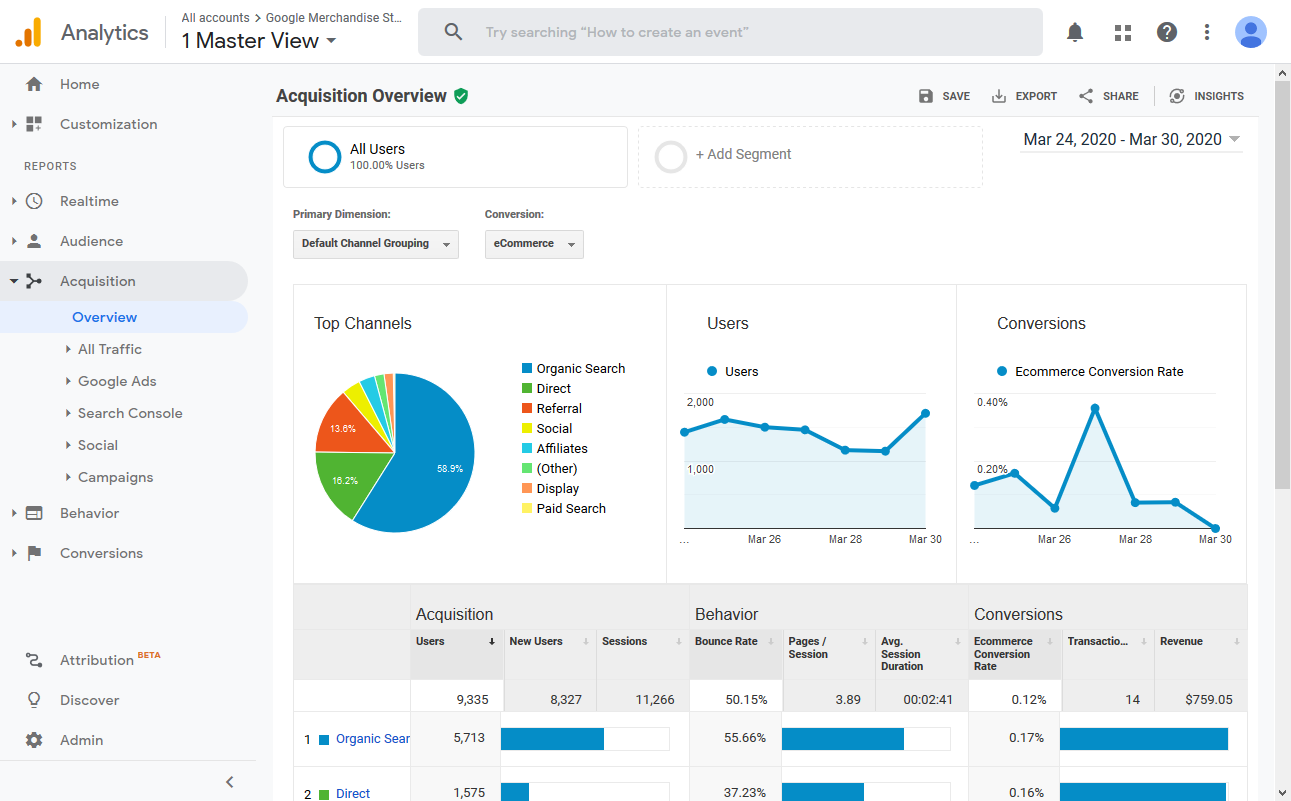
Acquisition reports show you how people locate your site or blog. They usually present data showing the medium and source of your site users, along with other acquisition metrics.
There are detailed statistics for your traffic from organic leads (if you have a Google Search Console account), paid leads from Google AdWords, traffic from personalized campaign tags, and leads from social media platforms.

These sources also show you how visitors got to your website. They are divided into referral and direct traffic where direct includes visitors that typed URL directly, clicked on a bookmark, selected an auto-complete choice, or in scenarios where the tool cannot ascertain the source of the user.
Referral traffic, on the other hand, is where a user lands on your site through clicking on a particular link from another website, social media, or search engine.

These home and real-time reports show how people are using and viewing your site. The information is usually processed within seconds, and you can see data for the last 30 minutes. The active users’ data located under ‘Audience’ shows you unique users who visited your site within specific days.

This section allows you to see what percentage of your site traffic came from the various search engines, either paid or organic search. Organic refers to users who landed on your website via organic links on SERPs (Search Engine Results Pages).
Paid results, on the other hand, show visitors who came to your site through paid search engine advertisements; they usually appear on the top and side of organic search results. They are managed through advertising accounts like Bing Ads or Google Ad Words.

Tells the pages that people are viewing on your site. When a user moves to another page or closes their browser, the page that was displayed as active is closed in the real-time reports.

This report is found in ‘Multi-Channel Funnels,’ and shows you which marketing platforms helped you in making a sale. For instance, if a person comes to your website from Twitter, left, and then came back later on through Google Ads, the conversion will also be attributed to Facebook.
It also helps you determine other platforms that contributed to making the sale depending on dimensions like Campaign, Medium, Source, landing pages, and so on.

This report tells you the session, in question, cost, as well as the revenue performance of any other non-Google, paid marketing campaign. The report can quickly scrutinize how bad or good your marketing efforts are doing by comparing costs against the associated revenues.

When a person visits your website for the first time, a unique and new visitor is noted. If the same person comes back again to the website, only a new visit is noted. Google Analytics can recognize whether a user has visited the site before or not using cookies.
This technically means that if a person clears their cookies or accesses your website through a different computer or device, they can be erroneously added as a new and unique visitor. Because of this, the platform usually focuses mainly on visits data.

Segments enable you to analyze your data in more detail, by filtering the results to show only information for certain kinds of traffic. You can also use parts to compare results between groups of visitors; for example, new vs. returning, or paid vs. organic search traffic. Google also allows you to set up custom segments for even more granular analysis.

The user flow report tells you how your site users navigated your website from the main page to the exit page. The data can be adjusted to show extra details like traffic source, location of your users, and how many people left at each phase of the interaction.
Use this to identify your main landing pages and observe if the users are flowing to the money pages, if not, you should probably tweak it up to make them convert.

An audience is a specific set of users you group together depending on features found useful to your brand. Once you define your target audience, you can activate the audience in various platforms like Video 360, and Google Ads Display to better tailor your marketing campaigns.
You can also use the Audience feature on Google Analytics to further explore and analyze consumer behavior.

Bounce rate refers to the number of single-page sessions on your site. Individual pages have their bounce rate, and your website as a whole also has a bounce rate. High bounce rates usually indicate that there is a problem with your pages; they could be uninteresting or confusing, and as such, do not entice users to stick around.

This section has all the information about your site visitors. This includes; their location, the browser they are using, the operating system, how long they were on your site, and so on. It is a very crucial area, and it can help you answer important questions like;
Fortunately for medium-sized and small enterprises, the free standard version of Google Analytics offers more than enough details to help them guide their marketing campaigns.
On the other hand, for multinationals that need additional reporting capabilities or capacity, the premium option has thousands of insights to offer that actually justify the $150,000 per year.
The Google Analytics dashboard can feel like doing a 100m race with your eyes closed. There is a blend of fear and confusion. Your pulse racing and armpits sweaty. Hopefully, this guide on google analytics metric definitions enabled you to see the track a bit clearer.
Updated: 14 July 2025


Save thousands of dollars (it’s 100x cheaper)

Zero risk of Google penalty (it’s Google-approved)

Boost your rankings (proven by case studies)
Rank High With This Link Strategy
Precise, Simplified, Fast Internal Linking.
