1
Steph W. from SEOPressor

👋 Hey there! Would you like to try out this New AI-Powered App that'll...
...help you check your website and tell you exactly how to rank higher?

Actionable SEO tips, tutorials, and insights to help you rank higher.
88
score %
SEO Score

Found us from search engine?
We rank high, you can too.
SEOPressor helps you to optimize your on-page SEO for higher & improved search ranking.
By vivian on July 5, 2019
Hi! I’m sure the majority of you here are website owners. Don’t leave this page yet even though you’re not one. You could be, someday. I will be sharing with all of you a very important tool for businesses and website owners. Did I mention it’s FREE?
The tool I am mentioning here is Google Analytics. Have you heard of it? Are you figuring out how to use it? For those of you who already have an account, good for you. And for those of you who do not have an account, do not worry, it’s never too late.
Let me guide you through what this web analytics tool is about.

Google Analytics’ logo.
Google Analytics (GA) is a web analytics tool offered by Google on 14 November 2005. The tool has everything you need to bring your business to a greater level. How?
This data reporting tool gives you important and unique insights about visitors on your websites or in other words, your site traffic. When you understand your customers, you are less likely to lose them.
With the details provided by GA, you can make better decisions such as enhancing content for particular posts when you are aware that the visitors’ average time on page is low while the bounce rate is high.
Helpful! The best part of this “business-changing” tool is you can use it for free. Yes, I know I’ve mentioned it just now but I can’t help but emphasize on it.
Of course, their paid version, Google Analytics 360, has better features compared to the free version. To name a few, data freshness is guaranteed within 4 hours under the service-level agreement (SLA) and advanced, customizable funnel reporting.
However, if you are a small or medium-sized business owner, the free version has more than enough features for you to take advantage of.
I remember my first time using the Google data analysis tool like it was yesterday. All the data on the homepage seem intimidating and challenging…
But that’s only the first impression; it actually isn’t difficult to understand the tool and its features. It may be exciting and interesting to many people because of the vast array of actionable data presented.
The home dashboard contains snapshots of the various reports that can be found on the left panel, namely, Realtime, Audience, Acquisition, Behavior, and Conversions. All of the reports will give you an overview report except Conversions. Let us go straight into details now.
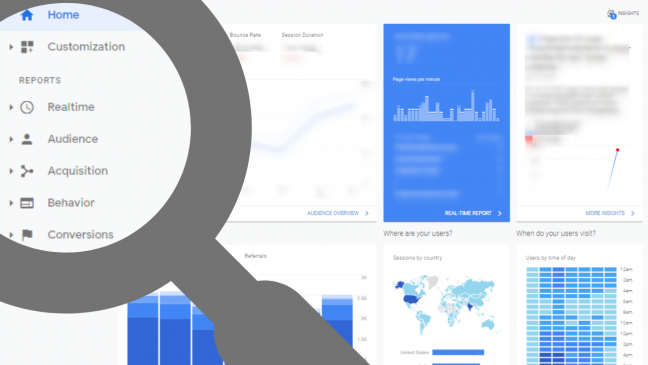
Google Analytics’ Home Dashboard and the left panel magnified.
The first report we will see under the reports tab is Realtime. The Real-time report shows you what is going on on your website at that very moment. How cool is that?
Here’s what data the report includes:
This is the only report in this article that contains data that are not very actionable. Well, this real-time report data will be transferred to the reports they belong to afterward. It’s nice to see how your site is doing in real-time once in a while.
The real-time report does help in a way. Let’s say you’ve set up a campaign and you want to be the first to see whether the feature works or not instead of letting your visitors tell you.
You can test it out and check the GA real-time report to see if there are any conversions made instead of waiting for the Conversion Report to be updated. It keeps you one step ahead of your customers.
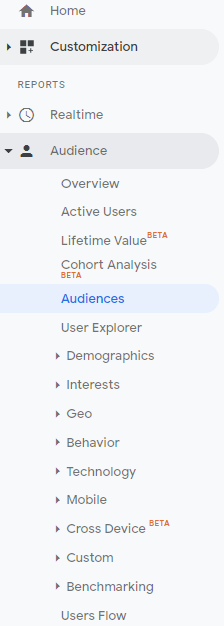
Audience Report tab as seen on the left panel.
The key benefit of the Audience Report is it gives you all the information you need about your visitors. When you completely understand your audiences, you can cater to them better.
The information found in the report includes your audience base (total number of users and new users for the week) and the audience’s demographics (the country and city they’re from as well as the language they use).
Besides that, it also identifies the technology used whether it’s a system or mobile and their interests which include affinity category and in-market segment.
In short, it tells you what type of audiences you have and from there, you can see if you’re targeting the audience you want or whether which audience you should target.

Google Analytics’ Audience Overview dashboard
On the overview dashboard, you’ll be able to see a graph where you can pick and view the dimension (average session duration, bounce rate, new users, etc.) that you want to see.
For instance, the graph in the picture above is viewing the trend of users to average session duration. The dimension can be viewed alone in the graph or compared with other dimensions and be viewed in one graph.
The graph will only show you the trend for two dimensions at a time. Besides the graph, below, you will have statistics of other dimensions, demographics such as country and city, systems and mobile.
Of course, this is just an overview. Most of the items can be clicked into and they will lead you to more in-depth data.
Once again, with this data, you get to completely understand your audience. Ultimately, you will be able to design a strategy that works on them.
Let’s say you’re a company that produces merchandise and Google Analytics analyzed that your audiences are movie lovers, you can start coming up with merchandise that is movie themed.
That’s how you start to get your conversion rate higher.
The Acquisition Report is found under the Audience Report. The acquisition report tells you how your website acquired visitors or where you’re getting traffic from which is very important information for website owners.
The report benefits owners that use multiple channels and social media platforms to promote their business. With the data found in this report, you can tell whether the channels you’ve put your effort into are working.
Without Google Analytics, you can only depend on the number of likes and share. That’s only for social media. For channels like email, only if people reply to your email, then you’ll know it is effective.
With Google Analytics, it lets you know where your website traffic comes from so you do not have to wonder if your efforts are effective or not. If time and money are a limitation, use the report and identify which channel to abandon.
Let’s have a look at the overview dashboard.
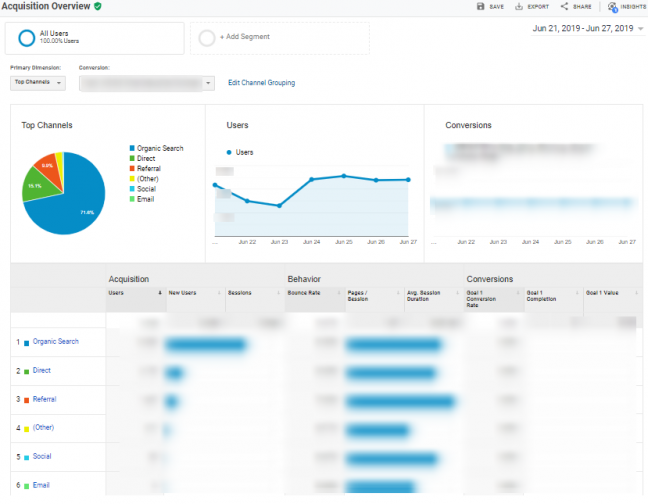
Google Analytics’ Acquisition Overview dashboard
On the dashboard, you’ll be able to see a pie chart of the top channels that are bringing in traffic to your website, the numbers of users acquired each day and the numbers of users acquired each day.
Not only that, but you’ll also see the conversions you’ve made each day as well as the acquisition, behavior, and conversions statistics in numbers and bar graph.
If you’re investing in several influencers and channels to promote your website and business, you can use the data in the report to tell you which one is effective and worth investing in.
This way, you’ll get to save costs and invest your resources in somewhere more important.
Next on the list, we have the Behaviour Report. The report gives you invaluable insights into the actions users are taking on your website. How does this data analytics benefit you?
With this report, you can know whether people are really reading your page, how many of them revisited your site more than 1 time, the bounce rate and many more.
Your audience behavior on your website tells you a lot. If they are not interacting much (high bounce rate, low average time on page, etc), you know something is not right and it is time to make things right.
It may be because of the content which isn’t engaging enough or it could be the loading speed of the website. In other words, the web analytics data will guide you to improve user experience.
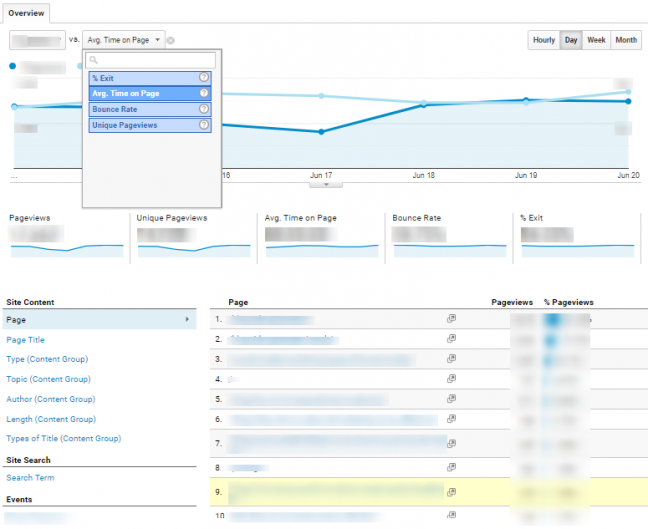
Google Analytics’ Behavior Overview dashboard
On the overview dashboard, you’ll see a graph that presents to you the trend of the dimension and date range that you’ve chosen. The graph allows you to put in another dimension so you can see the bigger picture.
Below the graph are the stats for page views, unique page views, average time on page, bounce rate and exit percentage of all your pages. You would want your audience to interact more with your site.
Set a benchmark with these statistics. It can be a daily, weekly or monthly thing. It’s up to you. The following is what you should aim for:
Your website will grow when you track your data and see improvements each time.
The Behavior Report tells you which pages are doing well and which are not, based on multiple statistics.
From there, you’ll know the topics that really interest your audiences. When you create content that the audiences are interested in, they will interact on your website and help your website rank. It may help you gain conversions as well.
On a side note, if you are interested to know how you can get your visitors to stay, I have an article for you that provides you 11 ways you can work on to get visitors to stay longer.

What is conversion? According to Google Analytics, it is a completed activity. There are two types of conversions: micro and macro conversion.
A micro conversion is a completed activity such as email signup. A macro conversion is one that involves a transaction.
The conversion tab is only useful if you have set goals. The key benefit of the Conversion Report is it lets you know whether or not you’ve attained your goals.
Attaining one goal at a time brings you closer to where you desire to be. The good thing about using GA is we don’t have to manually track our progress. Google Analytics does it for us.
For most websites, there usually is a purpose. The purpose could be wanting people to sign up for newsletters, buying something from your website or even just reading your content. When people take action, it means that there is a conversion.
It is important to track the conversion rate because it tells you out of the total visitors, how many people take action. The higher the conversion rate, the better you’re doing.
Here’s how you can create goals: at the bottom part of the left panel, you will see Admin. Click on it and you will see goals in the third column. Next, just click “+New Goal”. You can only set a maximum of 20 goals at a time so make sure you think carefully beforehand.
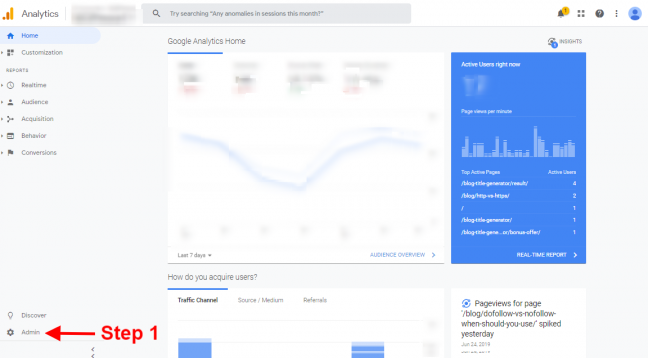
Step 1: Click on Admin

Step 2: Click on Goals
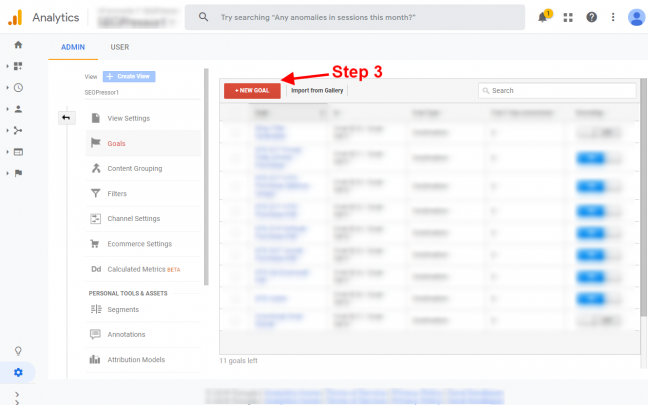
Step 3: Click +New Goals
An example of how you can use conversion is when you have created an exit pop on your website that leads to newsletter signup, you can use the conversion report to tell you how successful it is.
Always think carefully about your definition of success for your website. When you know clearly what you’re aiming for, you will set the right goals and track the right things. Ultimately, it will elevate your business.
If you would like to know the ways you can increase conversion rate, check out this interesting article: 6 Psychology Hacks Marketers Use to Increase Conversion Rate.

Google Analytics provides data about users for a reason. These data are meant to help you come up with the right decisions and strategies.
For there to be data, you need people to visit your website. So… how can you get people to your website?
The answer is simple: Always put your target audience in mind. When you put sugar on the floor, you’ll see ants marching towards it. Same concept here. If you provide what your target audience is looking for, they will find their way to you.

Imagine 10 people are searching the web, for one thing, let’s say bottle, do you think they are putting the same words on the search bar?
You’re right, people do not search the same terms for that one thing. They vary. Some may search “stainless steel bottle”, “water tumbler”, or “BPA-free water bottle”
Think of what your target audience will search for. The easy way to do this is to use a keyword research tool. The keyword research tool will give you words that are closely related to your keyword. With this, you can rank and show up on the Google result page for multiple keywords and capture all opportunities.

Keyword Research Tool: LSIGraph
When users stumble upon your website, you’ll get pageviews. You might be thinking, the more the better right? Well, that’s not the case.
Having your target audience visiting your website is not enough. High page views but low average time on page and high bounce rate are pointless and bad for your website.
You need them to stay on your site and take actions like spending more time on your website, clicking into links and sharing your content with others. When they stay and take action, it tells you that you are doing the right things on your website. People like your website.
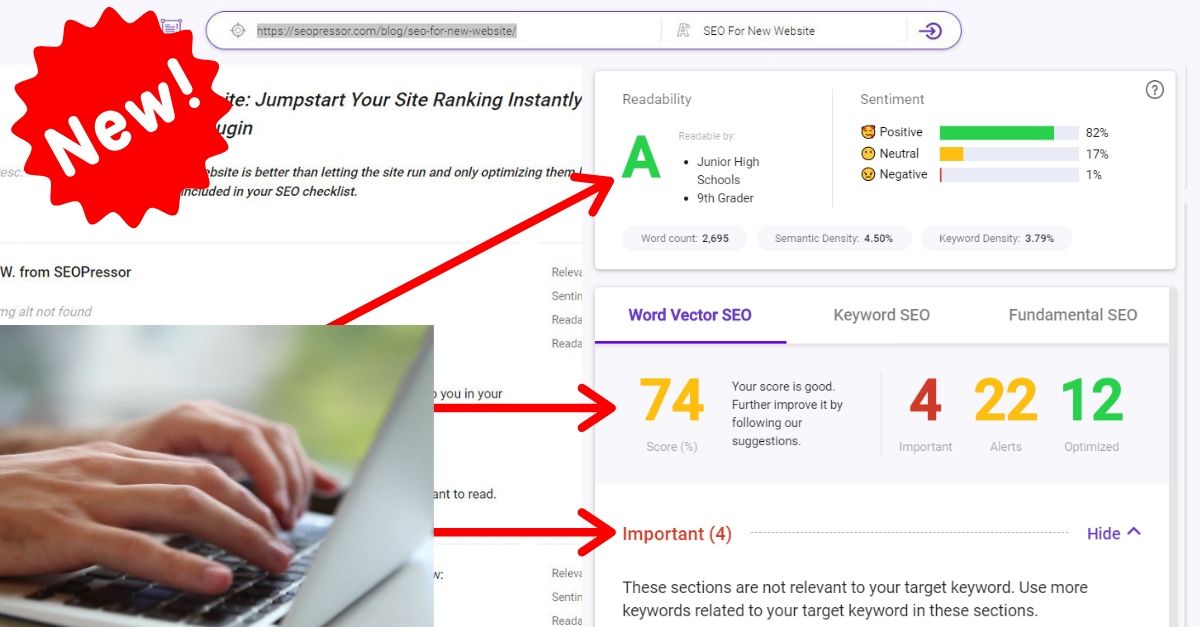
You can use an SEO plugin as a guide to creating the “close-to-perfect” content. You can check out our SEO plugin while you’re at it: SEOPressor Connect.
An SEO plugin typically assists you to create content that will make users stay longer. Some of the things SEO plugin highlights to you are whether there are sufficient keywords, links, and images on your website.
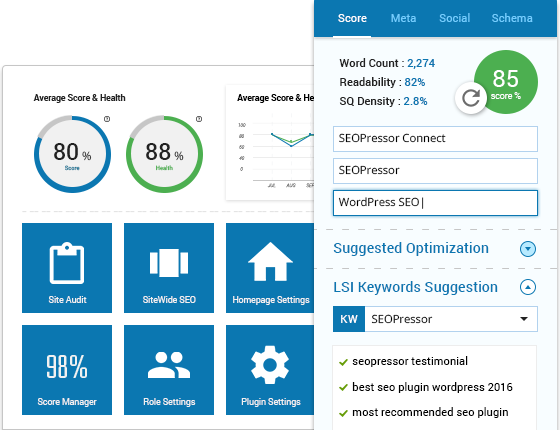
SEOPressor Connect guides you to create the “close-to-perfect” content.
When you optimize and people start engaging on your website, it tells the search engine that you have a good and useful website, which will help you rank on Google.
And guess what? Ranking on Google means more visibility (which also means more data)! Therefore, it’s always a WIN when you put your target audience in mind. In fact, it should be a rule.
We’ve come to the end of the article. I hope that with this, you’ll have a rough idea of what Google Analytics is about and how it would help you.
What do you think of this free data reporting tool? Are you interested in using the Google Analytics account now? Let me know in the comment section below!
Updated: 26 July 2026

Subscribe and receive exclusive insider tips and tricks on SEO.
Delivered to you right from the industry’s best SEO team.
Copyright © 2026 SEOPressor. All Rights Reserved.
Powered by Semantics BigData Analytics (SBDA).
