1
Steph W. from SEOPressor

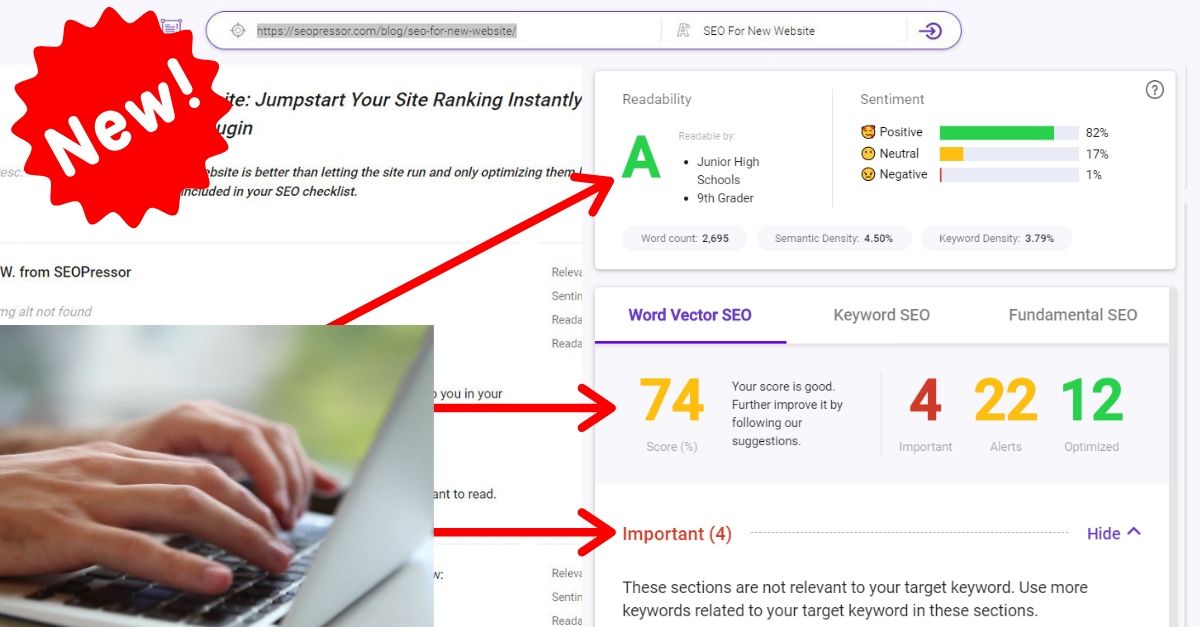
👋 Hey there! Would you like to try out this New AI-Powered App that'll...
...help you check your website and tell you exactly how to rank higher?

Actionable SEO tips, tutorials, and insights to help you rank higher.
99
score %
SEO Score

Found us from search engine?
We rank high, you can too.
SEOPressor helps you to optimize your on-page SEO for higher & improved search ranking.
By jiathong on December 2, 2019
If you’re using Google Analytics, you will have access to a bunch of data that come from Google monitoring the user experience of your visitors. Those data are used to gauge your website performance and also play a role in your SERP.
In this blog post we are going to talk about: what is user experience, how does it affect SEO, how to check your user experience signals data, and how those data matters.

What is user experience?
First of all. What is the user experience? Let’s look at it from a visitor’s perspective. When someone visits your website, how comfortable your website is? Did they get what they visit the website for?
Comfortability can concerns how easily they can navigate through your website: Is there a visible toolbar with clear categories? Are the text size and font easy to the eyes? Does your website loads in seconds?
Matching up with visiting purpose to make sure the users get what they want: Are the title tags and meta descriptions misleading? Do you have a thin content problem? Do you have the product that they want?
It is actually really simple. To sum it up, the user experience is in fact, the way you present your website to your audience and how they feel navigating through it.
Here is the point, this is an era of overloaded information. You can get 100 pages of Google search results on anything you type into the search bar.
The allmighty Google
When a user reaches your website, the first thing they decide is whether or not they want to click on that X button. Even before they spend a few seconds to scroll through the web page.
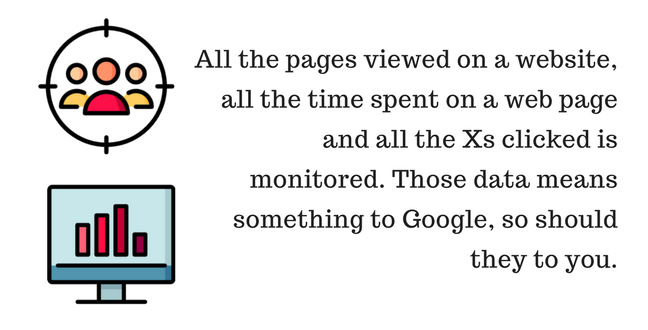
All those websites they clicked in, all those X they clicked on, all those seconds they spent on a webpage, means something.
Google keeps track of user behavior experience signals. All those clicks and seconds spent counts.
Why is that? Google as a search engine strives to give the user what exactly it is that they want and need. By tracking on user experience and user behavior signals, Google can gauge how relevant a website is to the users.
The point is a relevant website gains higher position on the SERP. A relevant website also gets more visits and business.
We have talked about how important a site speed is for ranking. We have also talked about building a responsive website. All those are parts of user experience that should be taken into account.
Ignoring user experience is one of the biggest SEO mistakes to avoid.
Google Analytics is one of the Google Webmaster Tools which is free to use. By using Google Analytics, you can have a glance at user experience signals.
Now, I’ll show you how you can access your website’s user experience signals. All you need to do is click on the behavior drop down bar, and click on overview.
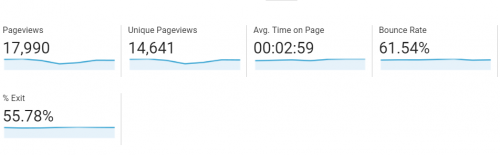
This is what you will see.
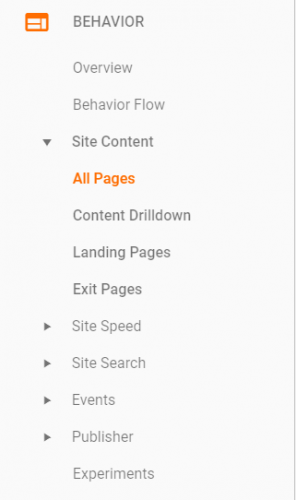
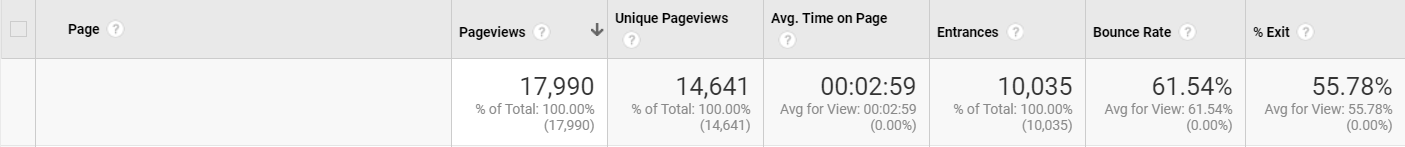
If you want more detailed data according to different pages. Simply click on the Site Content drop down bar and click on All pages. You will be presented with respective data according to pages.
There are a handful of data that you can access via Google Analytics.
But today we will be looking at these three signals: bounce rate, average time on page and exit rate.
Here’s how you can get the most of user experience signals out of a Google Analytics report.
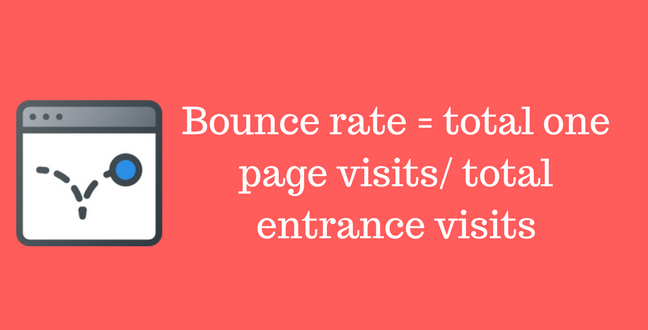
If a reader visits your website, stays on an article page then exit. It is considered a bounce. On the opposite, if a reader visits your website, browsed an article then click to another one, and another one, then it is not considered as a bounce.
What it means is, a visit session that only consists of one web page is a bounce. A lower bounce rate is usually preferred. Since it means a visitor is engaged with your website. It implies that your website is relevant to their query or interest.
Imagine a website selling shoes, if a visitor clicked on the page selling a pair of red sneakers, then exit the website altogether. We can safely assume that they did not find what they want.
But if the visitor, after the red sneakers product page, clicks on the white sneakers product page then the blue sneakers product page. We can assume that they are interested in the things offered. Thus, the higher level of engagement.

No, not this kind pf bounce.
This is how Google views bounce rate. For Google, a page with a high bounce rate means less relevancy, less relevance means lower SERP position.
That’s how user experience can influence your SERP ranking.
When you create a web page, there is always a goal. Think about what is the goal of the web page then associate it with the bounce rate. Is it achieved?
If a homepage has a high bounce rate. That should be concerning. The main function of a home page is to serve as a navigation ground to visitors to explore your whole website. If they are not clicking on links to check out your other pages. Then that is not a very good homepage.

Browsing, browsing, and browsing…
This is pretty much self-explanatory, average time on page is just that, the average time a user spent on a web page (according to Google standard anyway). If you want an in-depth explanation on how Google attain the data itself, have a read at Misunderstood Metrics: Time on Page / Average Session Duration.
For content creators, you want people to actually go through what you have created. If you have written a massive three thousand word article. But your average time on page is only 30 seconds. It is clear that the visitors didn’t really read your work.
For business, it’s normal for potential customers to spend time on a product page to read the reviews or product descriptions. If they spend more time on a product page, we can safely assume that they are interested in the product.
There are a couple of reasons that can influence average time on page.
Starting from the web page itself. If the top of the fold, which is the area of the web page accessible to a user without needing to scroll down, is filled with advertisements. Or the users are overwhelmed with multiple pop-ups the moment they enter a web page. You can be sure that the visitor will nope out of the web page in a heartbeat.

Nope-ing out of a website.
If the website design is perfectly functional and user-friendly, yet the average time on page is short. Then maybe the problem lies in the content. If it’s a blog, is the content relevant to the title? Is the formatting easy to the eye and retains attention?
If it’s a product page, do you feature basic information about the products? Picture, measurement, price, availability, options, reviews, all those are crucial for a customer to consider if they are looking for something to put into the cart.
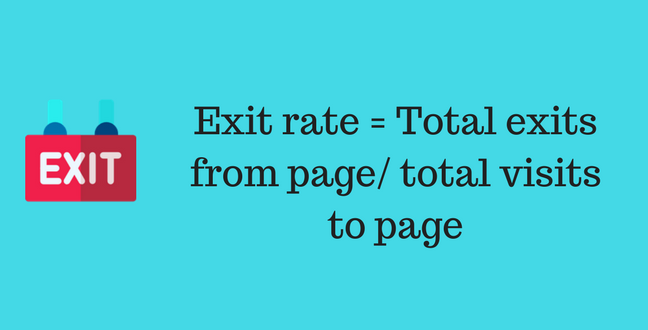
When a user exits your website, it means they clicked on that x button. That simple.
Let’s look at an example. The first web page the visitor has visited on your website is www.product.com/shoe/red, then looked at xxx.product.com/shoe/white and finally, they also browsed xxx.product.xom/shoe/blue then they exited the page.
So where does the exit happens? It’s simple, the answer is – xxx.product.com/shoe/blue.
Now, the exit rate is a little more ambiguous way to gauge user experience. Because a visitor has to visit your website at some point right?
So what you need to do is, associate the purpose of a certain web page with the exit rate. Then see whether it is natural for a visitor to exit on that certain page.
Let’s look at some examples. A blog post tends to have higher exit rate. The purpose of a blog post is mostly to educate the reader about something.
Because the users are there to read an article. When they are done reading it they will go on their merry way and continue browsing the web. Or whatever it is that they were doing before stumbling on your blog post. That’s normal.
A product list page is a different story. If the exit rate of the page is high, it means the visitors are not interested in your products at all. That’s not normal.
You want visitors to buy your products. But instead, they are exiting your website. That does not align with the purpose of the product page.

Red alert! High exit rate at product page!
What you can do it. By analyzing whether is high exit rate is normal or not. You should be aware that there is a problem. Red alert, high exit rate! The users are not liking this page. You need to fix that.
If you are using Google Analytics but have no idea how those data could be of use. Bounce rate, average time on page and exit rate are three user experience signals that you can get from a Google Analytics report that is very useful.
Gauge how your web pages are performing by associating the purpose of a page with those three user experience signals. Examples: high bounce rate and exit rate on a homepage are not normal. Blog posts tend to have a higher bounce and exit rate.
Short average time on page for blog posts shows that users are not engaged with your content.
Updated: 2 August 2026

Subscribe and receive exclusive insider tips and tricks on SEO.
Delivered to you right from the industry’s best SEO team.
Copyright © 2026 SEOPressor. All Rights Reserved.
Powered by Semantics BigData Analytics (SBDA).
