1
Steph W. from SEOPressor

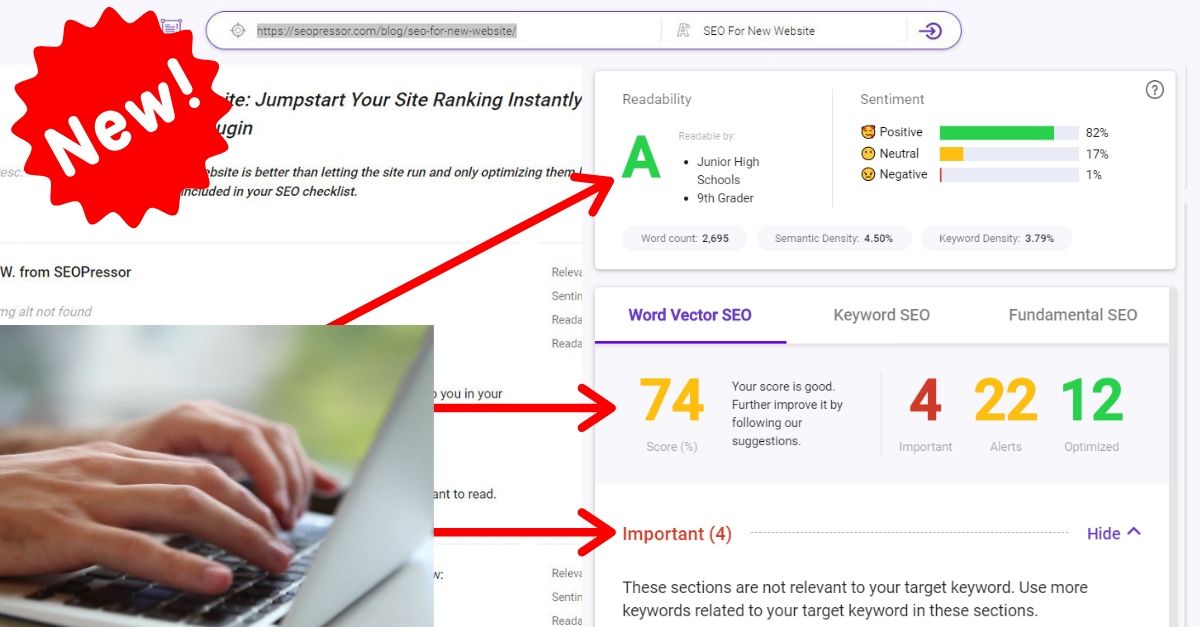
👋 Hey there! Would you like to try out this New AI-Powered App that'll...
...help you check your website and tell you exactly how to rank higher?

78
score %
SEO Score
Found us from search engine?
We rank high, you can too.
SEOPressor helps you to optimize your on-page SEO for higher & improved search ranking.
By vivian on March 24, 2016

One of the most important things that you’ll do for your blog is to measure your success. Just as with any good marketing strategy, your content marketing strategy is not a “set it and forget it” type of deal. In order to consistently improve your strategy, you’ll need to do a blog analysis.
Wait, but that sounds like a lot of work…can we just skip it?
No. Do you want your blog to succeed? Do you want your blog to grow? Do you want to make sales and run a successful business? I imagine that the answer to all of those questions is yes.
Therefore, you need to do a blog analysis to understand what works and what doesn’t.
There are so many different metrics to look at when you’re conducting an analysis of your blog. Essentially, you want to track your KPIs, or key performance indicators. A key performance indicator is a metric used to evaluate factors that are crucial to success.
So, which parts of your strategy are must-haves to ensure the success of your blog? Probably things like organic entrances, total pageviews, average time on page, and metrics like that, right? So you take those metrics and you measure them against pieces of your strategy.
Let’s go over 6 metrics that you need to measure every time you do a blog analysis:

A study conducted by Medium found that optimal blog post length is 1,600 words, or about a 7-minute read. How do you measure up to that?
But more importantly, how does your KPI measure up to that?
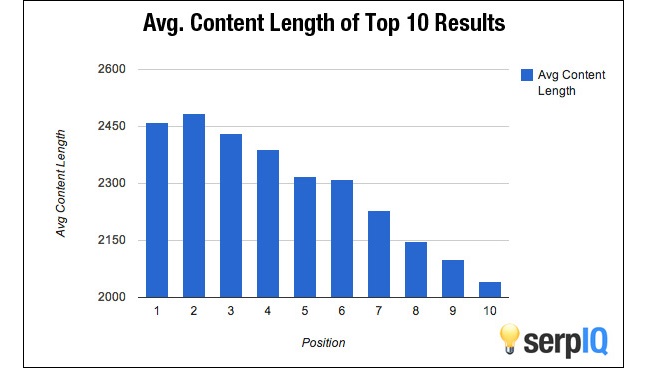 This correlation between length of post and ranking has been studied by many SEO experts and the majority of them agrees that posts with an average of 2,500 words gets the best ranking.
Despite the many studies that have already been done, you should still run a blog analysis and analyze which length of blog post suits your readers the most. Which length of blog post gets you the most traffic and from the data you’ve collected, you can decide how many words you should write for each blog post.
Another way to measure success for your blog (and another must-check metric for your blog analysis) is to see which topics garner a higher number of post views.
Check your Google Analytics and make a chart to see which topics are the most popular (i.e., have a higher number of post views). Also look at which topics are the least popular (i.e., have a lower number of post views).
This is extremely important in updating your content marketing strategy. If there’s a serious pattern to which topics/categories are not gaining traffic, then you probably want to cut those topics out of your strategy or figure out a better way to relate them to your readers and topics that do better. Look for a pattern for topics that do perform well with your readers and make a note to write about that topic more often.

Next, you’re going to want to check for a pattern in the format of the post and the number of social shares. What do people like to read and share most?
When we talk about format, we mean what shape does the content take? Is it an article or blog post? Is it a Slideshare? An infographic? A podcast? Or something else entirely? It’s a good idea to play with a variety of content formats because different readers will prefer different methods of digesting what you have to say. It’s also a great way to see which formats resonate better with your readers.
Take a look at which posts are getting the most social shares. Are these written blog posts, audio posts, or visual posts? Create another chart to get a good look at which types of posts are more popular. Make notes to include more of the most popular types of content in your strategy. Social shares get more earned traffic to your blog, and that is exactly what you want to see. Make your readers happy and give them more of what they want.

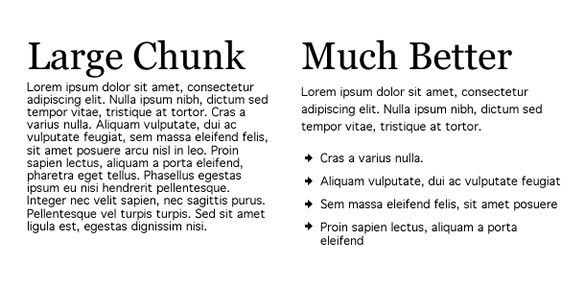
There’s not much that will send someone flying from your blog posts faster than a wall of text.
There are many ways to break up your content, such as with shorter paragraphs, subheadings, or images. And that’s what this analysis is all about: your text to image ratio. If you’re not using images to help explain your point and to help break up your content, then people are going to get bored with only text and not want to read your entire article. This will cause them to quickly leave your site without clicking around to other articles, causing your bounce rate to skyrocket.
Adjust your content strategy to add in more images to your content. Use relevant photographs to help illustrate your points or take screenshots to help demonstrate what you’re talking about. Including more images can help to make your content easier to read and make users want to stay on your website and read other content.
The next step in your blog analysis is to check out your blog post headlines. You’re also going to measure these with the number of post views metric. Make a chart with the different types of headlines. For example, how many are how to’s (i.e., How to …), lists (i.e., 5 Reasons to …), benefit (i.e., How … Will Help You), curiosity inducing titles (i.e., How I Did … In … Days), fear inducing titles (i.e., What … Could Do to Your …), or clickbait titles (i.e., You Won’t Believe How … Did …).
All of these headlines will attract people differently. Typically people don’t like clickbait titles, so you generally want to stay away from those (even though they do tend to drive clicks). Take a look at your number of post views for all of your blog posts to see which headline types perform better than others. What really draws attention and gets people to read your article?
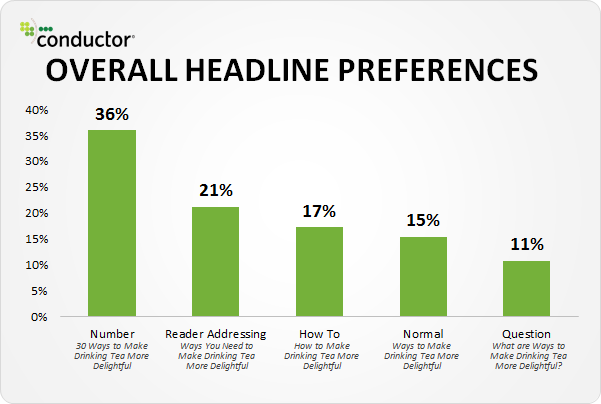
Study done by Conductor found that headlines that are most clicked on are number headlines.
Incorporate more of the popular headlines into your content strategy, test out different varieties of headlines to see which types your audience likes best, and get rid of the poorly performing headline types.

Your average pages per visit means the average number of pages that visitors to your website click to before exiting away from your site. You want this number to be high because that means that people are loving what they’re seeing on your site and they want more. This also increases your average session duration, another metric that you want to see a larger number for.
Your content readability is a good measure for your average pages per visit. If your content is difficult to comprehend or readers don’t like how it is written, then it’s not likely that they’re going to click around to read other blog posts or view other pages on your website.
However, if you’re writing in a conversational tone that is easy to understand and enjoy, then your readers are going to stick around for awhile and see what else you have to offer. They’re much more likely to click around to read your other blog posts.
Another great way to help your average pages per visit metric is to include lots of inbound links in all of your content and advertise other popular blog posts in your footer or sidebar. If your average pages per visit is only at one or two pages, then you want to reevaluate your content strategy to make sure that your content readability is the best it can be.
Content readability means a lot of different things. You can also refer back to the bullet on image to text ratio to see a few other tips for making your content more easy to read. Make sure that you’re using smaller words–it’s typically recommended to write your web content at a 5th or 6th grade reading level–and write in a conversational tone.
Leaving enough space in between lines, arranging information into lists are ways to improve content readability.
Use subheadings and images to break up your content so that readers aren’t faced with a wall of text. Use the proper font for your headlines and content to make sure your content is visually readable. Tell jokes in your content and keep the tone lighthearted and fun.
Make sure that you’re completing a blog analysis every few months so that you can continue to improve your content marketing strategy. Check all of these metrics to see which blog posts are performing better than others, and which blog posts you’re going to want to write less of.
Related Articles:
Updated: 1 April 2026

Struggling with internal linking?
Wish you could...

Automate internal linking
Use optimized anchor text
Fix 18 issues like orphan pages
Get link reporting and analytics


Save thousands of dollars (it’s 100x cheaper)
Zero risk of Google penalty (it’s Google-approved)
Boost your rankings (proven by case studies)
Rank High With This Link Strategy
Precise, Simplified, Fast Internal Linking.

Subscribe and receive exclusive insider tips and tricks on SEO.
Delivered to you right from the industry’s best SEO team.
Copyright © 2026 SEOPressor. All Rights Reserved.
Powered by Semantics BigData Analytics (SBDA).

